Home Contact Sitemap

AtPID

Arabidopsis thaliana Protein Interactome Database


  What's new in Version 5.00?

Summary of new data in the updated AtPID 5.0
Comparing with the last version AtPID 4.1 and other well-used protein-protein interaction resources (Table 1), the updated database indexed 45,382 curated PPIs and 118,556 predicted PPIs from literature mining, public database or computational approaches. These numbers significant increased due to the ravenous growth and maturing biomedical national processing language and the large-scale experiments for functional studies (8-10). We also generated a comprehensive chloroplast proteomics dataset in Arabidopsis by large-scale proteomics experiments and indexed all 3,134 credible chloroplast proteins into our annotation system. Furthermore, we systematically annotated 31,991 TFBS associations to 6,891 genes based on the integration of expression profiling and cis-regulatory elements information. This update largely enriches annotation of proteins in our database by tracking the recent research progress of related area and will greatly assist functional experiments and systematic studies.


  • Comprehensive annotation of genotype-phenotype associations

Using text mining and database integration, the previous version (AtPID 4.1) collected 5,121 mutants with significant observable phenotypes related to 3,431 genes. In the past years, through in-depth cooperation with Shanghai Society for Plant Biology, we collected 488 new mutants and systematically annotated all the existed and new curated mutants’ phenotypes to 167 standardized plant ontology format (Figure 1A). Comprehensive collection on phenotype data can help phenotype mechanism studies as what have been done in systematic exploration of disease associations (11,12). Strategies or algorithms have been developed to predict gene related function by integrating multiple level data (11-13). We integrated three different information, PPIs, co-expression from expression profiling and GO annotation with Naïve Bayes method. PPIs were quantified by the extended Czekanowski–Dice distance(14) and missing values were complemented by orthologs in other 14 species’ experimental PPIs from STRING database (15). Shared Smallest Biological Processes (SSBPs) was applied to describe the possibility of gene interactions on GO annotation (16). Co-expression of gene pairs were computed over the microarrays mentioned above to predict regulatory interactions. The correlation coefficient values of the three information were low (PPIs-GO: 0.05; PPIs-co-expression: 0.08; co-expression-GO: -0.03), suggesting that features were independent from each other and satisfies with the assumption of Naïve Bayes method. Naïve Bayes was undertaken by e1071 package in R. The model showed high predictability, with average AUC 0.72. Finally, the prediction contains 4,457 novel gene-PO pairs with 1,369 genes, which could be a supplement to the known mutant information.


  • A friendly graphical interface to present the potential genome-wide regulatory interactions with different confidence in AtPID. An example of regulatory interactions of AT1G28570 in the graphical interface.


  • Discovery of novel mutant-phenotype associations by Naive Bayes approach

The known mutant's phenotype data collection from literatures and databases totally cover 3,847 genes, largely far from annotating the whole Arabidopsis genome. Here, we integrated three different information, PPIs, co-expression from expression profiling and GO annotation with Naive Bayes method to predict novel mutants phenotypes. Naive Bayes was undertaken by e1071 package in R. The model showed high predictability, with average AUC 0.72. Finally, the prediction contains 4,457 novel gene-phenotype interaction pairs with 1,369 genes, which could be a supplement to the known mutant' information.


  • Overview of update mutant' phenotypes from database, literatures and prediction


Riken database(fox)

Literatures

Prediction

No. of mutant lines

1,626

889


No. of gene-phenotype

2,383

1,280

4,457
No. of phenotypes 91 98 95
No. of mutant genes 1,165 561 1,369


  • User friendly visualization toolkit for comprehensive genotype-phenotype network

In addition to the prediction of genome-wide regulatory interactions in Arabidopsis, we also developed a friendly graphical interface to present the related results (Figure 1). With this concise interface, the information of regulatory candidates for certain target genes and possible interactions between TFs could be easily obtained. In summary, the genome-wide prediction and a friendly graphical interface are the novel characters of updated AtPID to integrate the distinctive regulatory data together for users.


    We use the vis.js ,the dynamic and browser based visualization library to take the place of the Java Applet. For the purpose of maximize display annotation information and optimization web data transmission, we re-development the online display tools, which providing more detailed network information output and having some online analysis tools. With the optimization of algorithm, if the component of the network is less than 100, it will be expended infinitely until the scale reach 100 or no new point could be added. User could analyze the query in the global view this way.(example)


    The basic

    Node size: protein degree
    Node shape: Regular pentagon, phosphoproteins; Five-pointed star, proteins which has selected organ info
    Node fill material: query protein
    Node label: protein ID
    Node mouse hovering: protein corresponding phenotypic picture, information and other detail annotation
    Node right menu: detailed protein annotation interface include other databases cross Links
    Solid line: PPI with evidence
    Dashed line: Predict PPI
    Line label: Predict PPI intensity
    Arrows: directional connection et. Transcriptional regulation
    Mouse moving Zoom or transform the whole display area, selection protein and protein connection

    Extended display

    1.Height some node by customer selection


    As an example,it is figure when you chose "Query height" and "Shape and degree"

    2.Filter display in accordance with the node degree


    As an example,it is figure when you chose "Filter when degree"

    3.Mark designated Subcelluar Location ,Related Organ or Related Pathway in protein network


    As an example,it is figure when you chose "cell suspension culture" in "Related organ"

    4.Switch different models of networks display


    As an example,it is figure when you chose "height edge weights and types" and "undirected"

    5.Show the detail information when mouse on the node of protein


    As an example,it is figure when mouse on the protein node "CPN60B"

    6.Point by specifying the node to expansion the existing network


    As an example,it is figure when you click or double click the node "SEP4"


  What's new in Version 4.00?

NEW DATA SOURCES
As the bioinformatics data rapidly updated and secondary resources cited easily leading to the increase of the potential bias in data repository, we avoid localizing to other data resources as much as possible in our platform, and make the greatest possible use of other database' data interface. In the process of literature data ensembling, we consider (measure) accuracy as the first standard, not one-sided pursue the amount and coverage of data, at the same time, standardized data mining processes, determine and record data manually, for each literature data archive the related literature info and keyword paragraph.

  • Node annotation info

Phenotype data:
Mutant has been widely used in functional genomics research, considering the advantages in seed mutagenesis, genetically modified and tissue culture, plants is easier to obtain stable traits, resource-rich mutant resources than animal. So far, a large number of characterized stable Arabidopsis mutants have been reported in research literature(Kuromori, Wada et al. 2006), and some seed resource databases. We integrated and classified research literature, seed resource database and TAIR-released phenotype data, annotate a part of mutant phenotypes based on Plant Ontology Standard (Jaiswal, Avraham et al. 2005). We provide related functions in order to facilitate the users to submit or modify the relevant mutant' phenotype annotation, which will be further standardized for measured phenotype distance.
Node annotation info is shown in Table1.

Annotation type.

Data sources.

The amount of data.

Subcellular localization

Go,SUBA,TEXT-MINING

8742 proteins

Functional Annotation

TAIR,GO,PO,NCBI

39640 proteins

Mutant information

Tair,NASC,RAPID, TEXT-MINING

5121Mutant,3431 genes

Pathway

KEGG

142pathways 5514protiens


  • Interaction annotation info

Transcriptional regulation data:
Main purpose of adding Gene transcription regulation information in the protein interaction network is through the transcriptional regulation information connect part of the static protein interaction network, makes the overall network more consistent with the biological reality.
Interaction annotation info is shown in Table2.

Annotation type.

Data sources.

The amount of data.

Protein complex

Swiss port,kegg

238 complex

Transcriptional regulation

TEXT-MINING,
NCBI GEO ,EBI array express
chip-analysis

8070 relation 5211proteins


NEW DISPLAY
For the purpose of maximize display annotation information and optimization web data transmission, we re-development the online display tools, which providing more detailed network information output and having some online analysis tools. With the optimization of algorithm, if the component of the network is less than 1500, it will be expended infinitely until the scale reach 1500 or no new point could be added. User could analyze the query in the global view this way. We plan to publish off-line version in the near future in order to facilitate the users to better display and analysis of relevant network information.


  Usage

How to query potential PPI pairs related with interested protein(s)?
AtPID provides manually collected PPI data and predicted PPI information through synthetic data resources. Users can access PPI information by querying one or more proteins or a PPI pair (http://atpid.biosino.org/query.php) [Simple search ] allows users to submit a single protein when you would like to know how many protein ,including the gold standard positive and prediction of PPI, have the probability to interact with the protein you have submit. [Pair search] allows users to submit a protein pair when you would like to know if there is an interaction between them. [Multiple search] allows users to query more than two proteins with comma separated format when you would like to get the interaction information among these proteins. All returned pages will tell users the related useful annotations of all proteins involved in certain interactive pathways. Additionally, query keywords, including UniProtKB/Swiss-Prot ID, TAIR AGI, Entrez Gene name, REFSEQ PROVISIONAL ID (NCBI) or International Protein Index (IPI) symbol, are all allowed.
 What are included in returned page after main query?
After you submit protein(s) or protein pair in Query Page, Basic protein information are returned , including Locus name(AGI), Symbol name, Number of interactions , other functional annotations and database cross-references. AtPID tells users how many GSP (golden standard positive) or predicted PPI pairs in the total number of interactions in this query. Domain information is also considered and graphically displayed in the bottom.Network Display ahead of the Search Results Page and Details of queried PPI can be linked to other windows when users click them.
What are shown in PPI information Page?
From querying returned page, users can link to the PPI of search Page for the PPIs information. For example, in PPI of simple Search Page (Fig.3), predicted PPI belonging to GSP and predicted functional partners without published evidence are listed respectively. In upper GSP information table, experimental or collecting methods and related references are shown.As for Predicted Functional Partners, corresponding LR from particular genome-wide detection methods are displayed by the style of abundance of the circle, respectively. The larger the circle is filled, the higher confidence the result from corresponding method for prediction. Total confidence score (final likehood ratio -LR) is behind each interaction.Additionally, methods utilized in our integration include O: Ortholog interaction datasets;G: Shared biological function:Go Ontology; E: Co-expression; F: Gene fusion method; N: Gene neighbors method; P: Phylogenetic profile method; D: Enriched domain pair.Similarly, the PPI of Pair Search and Multi Search also contain the mentioned information and links conveniently. If no PPI exist, AtPID will display sorry, no such data related to your querying.

Overview of the number of individual predictive dataset


No.predictive ppi pairs

No. proteins in the ppi pairs

O: Ortholog interaction datasets

3,045

1,359

G: Shared biological function:GO Ontology

553

523

E: Co-expression

14,837

8,024

F: Gene fusion method

6,570

5,671

N: Gene neighbors method

2,008

1,637

P: Phylogenetic profile method

15,723

8,751

D: Enriched domain pair

2,182

1,288

AtPID

28,062 (putative ppi with GSP)

23,396 (putative ppi without GSP)

Through integrating by Naive Bays Network, AtPID achieved 28,062 protein-protein interaction pairs with 23,396 pairs from prediction methods. There are seven individual datasets from various approaches, identified by O,G,E,F,N,P, and D. The details of each method can be browsed on AtPID FAQ.


How to display the interested PPI Network?
From the querying returned page, users can also link to the Network Display Page of the PPIs. Importantly, AtPID graphically displays the interaction network with submitted protein(s). It lays out the PPI network friendly and dynamically. Predicted functional relationship and confirmed functional relationship in this network are marked by blue and red straight line, respectively. The first depth of functional relationship(s) related to the submitted protein is represented by dark straight line while the second depth of functional relationship(s) is represented by dark arched line.Hollow triangle represents queried protein; hollow circularity represents functional partners of the queried protein. Hollow rectangle represents associated functional partners of queried protein.Red marked corresponding symbol represents such proteins have annotations while dark marked symbols represents that such proteins have no annotations.In this [Network Dispay Page] users can also extend protein-protein interaction with other interested proteins through Parameters Box below on the right side.
How to submit new data or report errors?
The AtPID system welcomes people in the Arabidopsis research community to publish their data and help us to catch up the latest related progress. AtPID provides windows access to upload PPI or subcellular localization information or report the data error to us flexibly. This window will extend the application of AtPID integration resources from broad laboratories and research communities. Users may enter Keywords, Details & Evidence and Author information. Then AtPID will parse and evaluate the validation of the data and then update AtPID accordingly.

For Developers and Service Provider ?
Linking to ATPID via a gene DB-identifier (e.g. UniProt or LocusLink)

Query url syntax:
www.megabionet.org/atpid/webfile/idcon.php?submit=GO&pro=[DB-identifier]

Linking to ATPID display tools

Query url syntax:
www.megabionet.org/atpid/webfile/snet.php?pro=[AGI ID]&max=[default=1500]


  General Introduction

What is AtPID?
The AtPID (Arabidopsis thaliana Protein Interactome Database) was constructed at the Center of Bioinformatics in Northeast Forest University to identify possible Protein-protein interaction pairs in model plant Arabidopsis thaliana. Protein-protein interaction can be defined as the physical interaction, the structural-related interaction, or functional linkages between proteins.
Although the AtPID is still in its early stages, there is no other protein-protein interaction database of Arabidopsis thaliana can be considered as an established standard database. We presume that a variety of databases trying to solve problems in diverse ways provide the biologists the possibility of choosing their interested points.
This database, who has an intuitive query interface allowing a easy access to all the features of proteins, was built up using open source technologies and will be freely available at http://atpid.biosino.org/ . We managed to provide an analysis and information platform for model plant Arabidopsis thaliana to incorporate experimental results and computational biological ways to research system biology. Everything in AtPID is freely available to all.
 What is the background of the scientists involved in establishing AtPID?
AtPID has been established by a team of biologists, bioinformaticists and software engineers led by Dr. TieLiu Shi at SIBS.
 Do you intend to commercialize the database?
We do not have any intentions to profit from AtPID. Our goal is to promote science by creating the infrastructure of AtPID. We hope to keep it updated with the assistance of the entire research community.


  Concepts & Methods

Protein-Protein Interaction (PPI)?
The collection of all interactions between the proteins of an organism is usually called the interactome .protein-rotein interactions is seen as a crucial prerequisite to understand cells function and the general principles that govern this function. Importantly, It can also lead us to better understand signal transduction and make some developmental analysis.

What is the bioinformatical method used within AtPID?
Arabidopsis thaliana Protein Interactome Database (AtPID) is an object database that integrates several prediction methods for protein-protein interaction and a wealth of information relevant to Arabidopsis thaliana biological resources. The prediction methods include the Ortholog Interactome method, the co-expression method, the SSBP GO annotation method, domain method ,the gene fusion method and the phylogenetic profiles Method .Data pertaining to thousands of protein-protein interactions, protein sublocation, protein domain information, gene expression regulation network are all extracted from the literature and related sparse datasets.

Ortholog interaction datasets

The ortholog proteins often retain similar functions, so a pair of orthologs that interacts in one organism is likely to interact in other organism5,6. Publicly available protein interaction datasets were downloaded from the DIP database (http://dip.doe-mbi.ucla.edu/dip/Download.cgi). These included the Saccharomyces cerevisiae set, rosophila melanogaster set, aenorhabditis elegans set, and Homo sapiens set. Ortholog map files were downloaded from the Inparanoid database (http://inparanoid.cgb.ki.se/). These data files provided ortholog maps between pairs of organisms. According to the conservation of ortholog interactions across the species, we transferred the information of the ortholog interaction data of other organisms to Arabidopsis thaliana, and obtained the Arabidopsis thaliana protein interaction data. If the likelihood ratio was NA, then the likelihood ratio was assigned with the maximum value available from other organisms. Ortholog Pairs were then tested against the GSP and GSN to derive likelihood ratios .

Shared biological function(SSBP GO annotation method)

Interacting proteins often function in the same biological process so proteins acting in the same process should be more likely to interact than proteins acting in distinct processes. Furthermore, proteins functioning in small, specific processes should be more likely to interact than proteins functioning in large, general processes. The following procedure was used to quantify functional similarity between two proteins: (1) identify all biological process term shared by two proteins; (2) count how many other proteins were assigned to each of the shared terms as well; (3) identify the shared biological process term with the smallest count (SSBP). In general, the smaller this count, the more specific is the biological process term, and the greater functional similarity between two proteins. Protein pairs were binned by this measure of functional similarity and then the degree of similarity was tested for its ability to predict protein-protein interactions.

Co-expression matrices

Interacting proteins often have similar gene expression patterns, so genes that are co-expressed should be more likely to interact than genes that are not co-expressed4. We collected all available AFFY Arabidopsis microarray datasets from TAIR (date up to May 2006). For each dataset, we first chose genes with values present in 50% of the profiled samples. Then Pearson correlations were calculated for each dataset and the gene pairs were grouped into 19 correlation bins (by tenths from -1 to 1, with -0.1 to 0.1 as a single bin). The degree of co-expression was then tested against the GSP and GSN to derive likelihood ratio. Finally, we selected five leaf related datasets (Submission Number is ME00319, ME00326, ME00338, ME00331 and ME00345) in which the likelihood ratios were considerably stronger and increased consistently with increasing coexpression.

Gene fusion method

The Gene Fusion Method is based on the hypothesis that pairs of monomeric proteins that are fused in other organisms tend to be functionally related or physically interacted.

Gene neighbors method

Some of the operons contained within a particular organism may be conserved across other organisms. The conservation of an operon's structure provides additional evidence that the genes within the operon are functionally coupled and are perhaps components of a protein complex or pathway. Several methods have been reported that identify conserved operons.

Phylogenetic profile method

The phylogenetic profile method uses the co-occurrence or absence of pairs of nonhomologous genes across genomes to infer functional relatedness [7,8]. The underlying assumption of this method is that pairs of nonhomologous proteins that are often present together in genomes, or absent together, are likely to have coevolved. That is, the organism is under evolutionary pressure to encode both or neither of the proteins within its genome and encoding just one of the proteins lowers its fitness. As in all of the above methods, we assume, and later confirm, that coevolved genes are likely to be members of the same pathway or complex.

Enriched domain pair

The functional units of proteins are domains, which are often repeated in various combinations in the proteins throughout the genome. It is well known that the protein interaction can be inferred from the domain interaction. We downloaded the domains from the Pfam database (http://www.sanger.ac.uk/Software/Pfam), and then searched domains in GSP protein pairs. The protein pairs containing these domains are considered to interact with each other. In this way, 5,337 pairs involving 438 proteins were found in genome-scale. Domain pairs were then tested against the GSP and GSN to derive likelihood ratios


Bayesian Network Approach

The Bayesian Networks approach was used to integrate the six predictive data sources and build a model to predict novel protein-protein interactions. A similar approach was applied to predict yeast protein complexes and was applied here as described by Jansen, 2003. The essence of the approach is to provide a mathematical rule explaining how to adjust the odds that a pair of proteins interacts given some predictive evidence. The prior odds of interaction were defined as:

Where P(pos) is the probability of finding an interacting pair of proteins among all pairs of proteins, and P(neg) is the probability of finding a non-interacting pair. The posterior odds or the odds that two proteins interact given new predictive evidence were defined as:

Where fi is a protein pair' value in dataset i. The likelihood ratio(LR show as the equation below):

Relates the prior odds and the posterior odds as defined by a derivation of Bayes rule:


When the evidence types integrated are independent (or non-redundant), the likelihood ratio can be calculated simply as the product of individual likelihood ratios from the respective evidence types. This is known as a Naive Bayes Network:


Individual likelihood ratios are easily calculated by counting the number of protein pairs with particular values (or bins of values) in the predictive dataset that overlap with the GSP and GSN sets. Also, the naive Bayes network is desirable because it lessens the initial data requirements and computational complexity required to build the model.
Intuitively, we anticipated that the majority of the data sources integrated would be nonredundant as the methods used to generate the data are unrelated thus the source for false positive predictions should be unrelated. After reviewing the evidence sources, we found that the shared biological function and enriched domain pair types were in some cases redundant, for example, where proteins are assigned to a biological processes based on their domains. So, to guard against over-estimating likelihood ratios when combining these evidence sources, we made an exception to the na茂ve Bayes model, and combined these two sources to a full Bayes model, that is we generated likelihood ratios for protein pairs binned by their values in both evidence sources. (See Redundant Data section above)

What is GSP and GSN?

Gold Standard Positive Interactions (GSP): Arabidopsis thaliana GSP is the protein pairs which have real interactions confirmed before retrieved from Pubmed, KEGG, and IntAct Database. GSP is used to compute LR score. We collected GSP manually from literature, the complex type interaction in GSP were collected from KEGG and the GSP pairs in IntAct DB were also added into the GSP datasets.
Gold Standard Negative Interactions (GSN):
The gold standard negative interaction set (GSN) was defined as all protein pairs in which one protein was assigned the plasma membrane cellular component and the other the nuclear cellular component, as assigned by Gene Ontology Consortium. The pairs in GSN means Protein ineraction won't occur in cell. They are used by the Bayesian Network as the negative datasets. We also used GSN to compute the LR score.

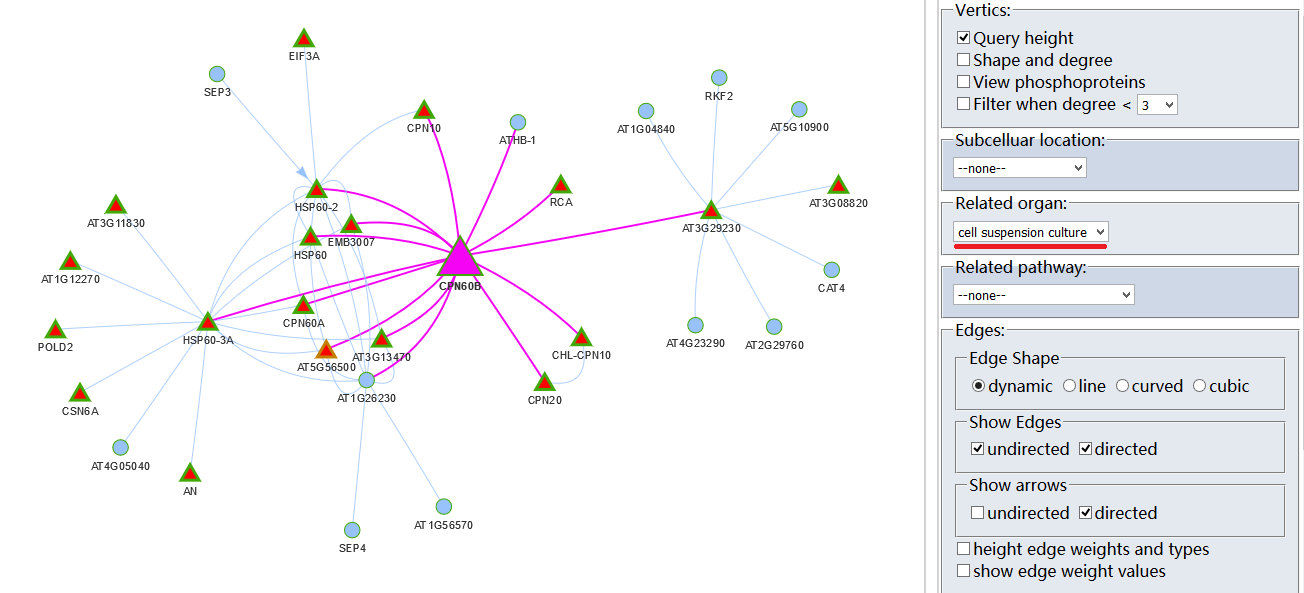
What does the displayed number mean when your mouse moved over a certain icon?(LR)

LR -the likelihood ratio which is calculated as Pr(CL|GSP) / Pr(CL|GSN), is directly related to the likelihood that two proteins interact. Through our integration method with Bayesian, High LR assigned to each predicted protein-protein pair indicates the possible of the interaction between the two proteins. The higher the LR is, the more possible the interaction relationship occurs between them.We have computed out LR cut-off to filter raw prediction results. The LR cut-off is 217.

GSP/GSN -the number of protein pairs in given classes that were present in the gold standard positive/negative set of interactions.

Pr(CL|GSP or GSN) -the probability of a protein pair having being part of a class given that it was present in the GSP/GSN.

The possible counts are the number of GSP/GSN interactions between two proteins represented in the respective datasets.

e.g. Ortholog interaction datasets

Caenorhabditis elegans (CE)