Help
1. Model
1.1 Diagnostic Model
1.2 Prognostic Model
2. Browse
2.1 Cancer types
2.2 DMG
2.3 FEM(PPI)
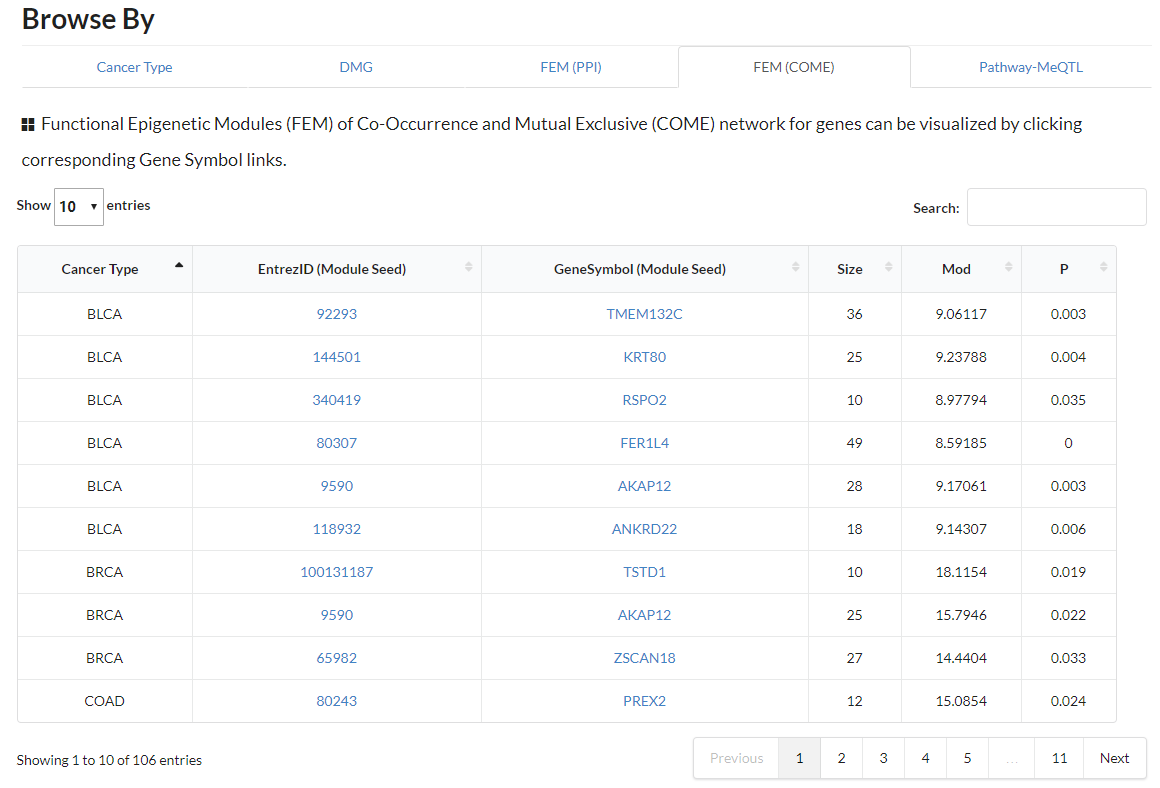
2.4 FEM(COME)
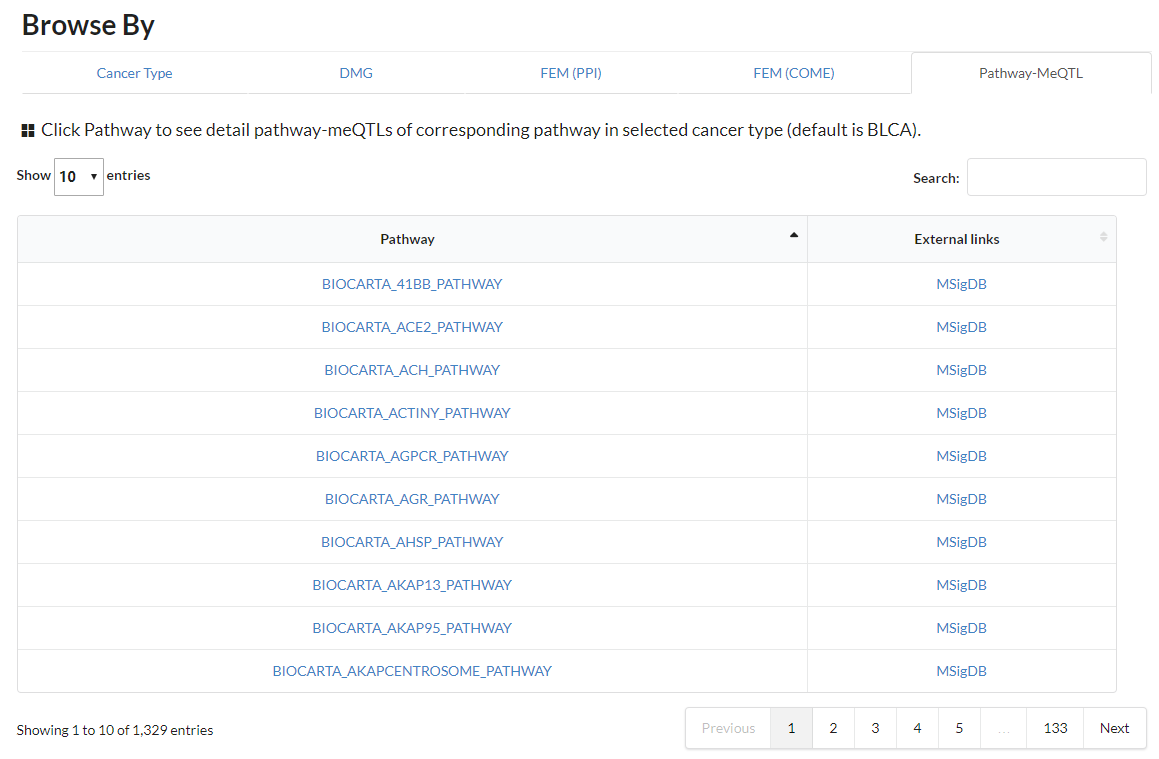
2.5 Pathway-meQTL
3. Information for CpGs
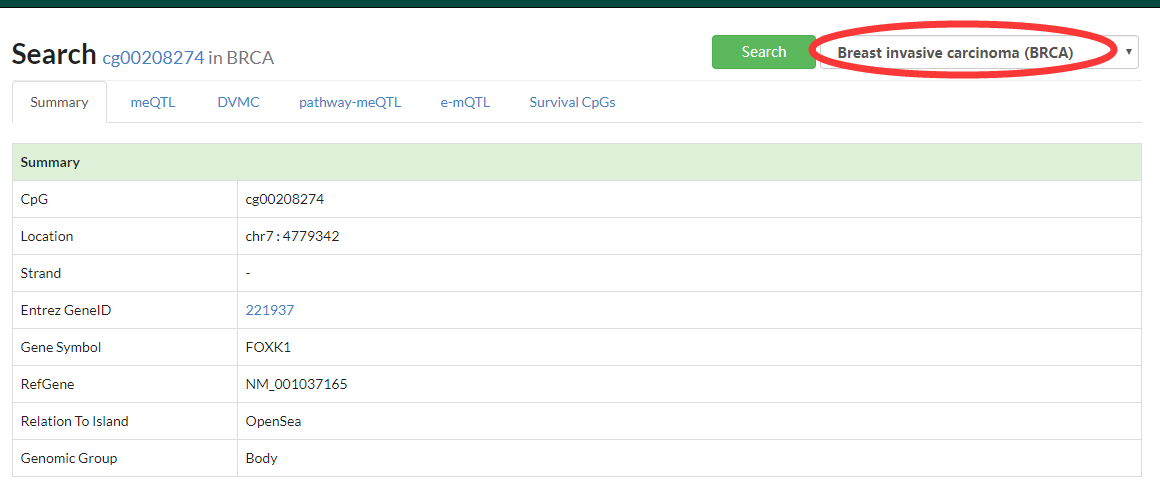
3.1 Summary
3.2 meQTL
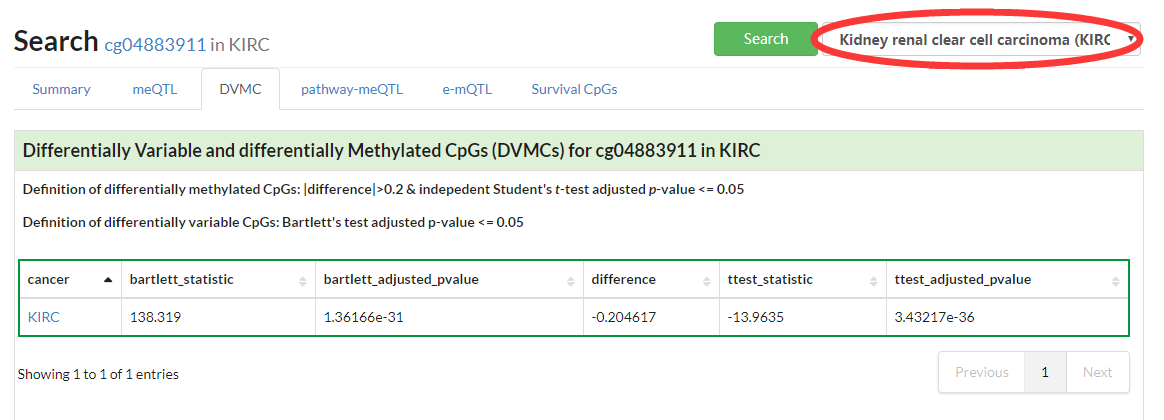
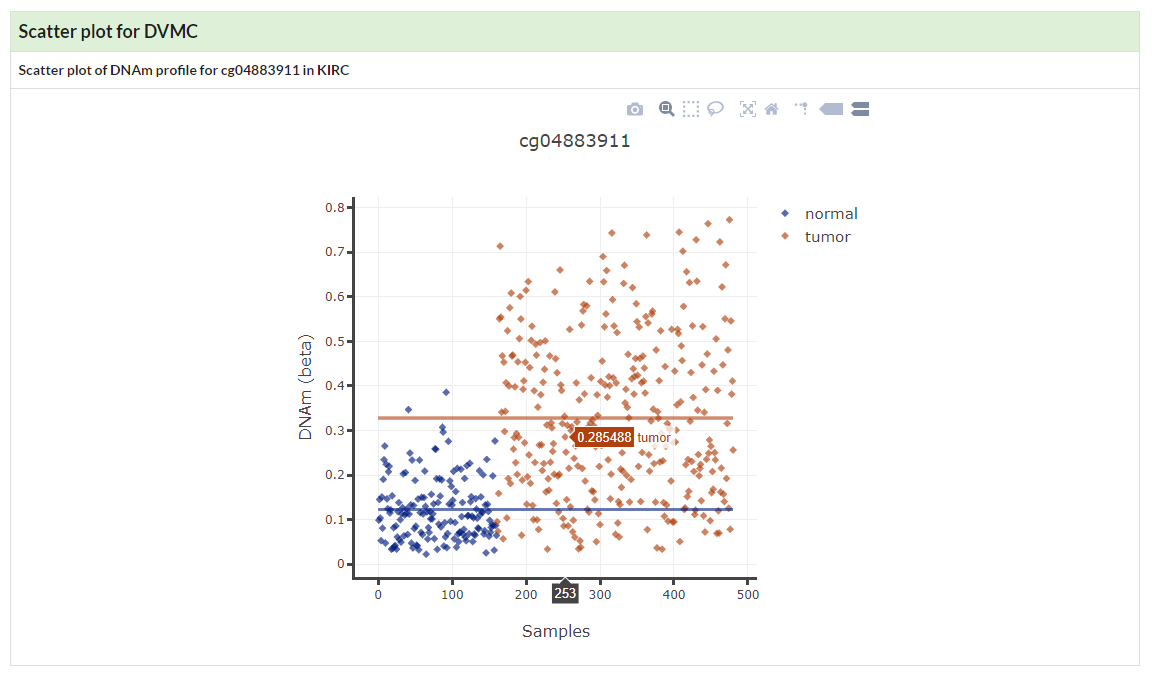
3.3 DVMC(Differentially Variable and differentially Methylated CpGs)
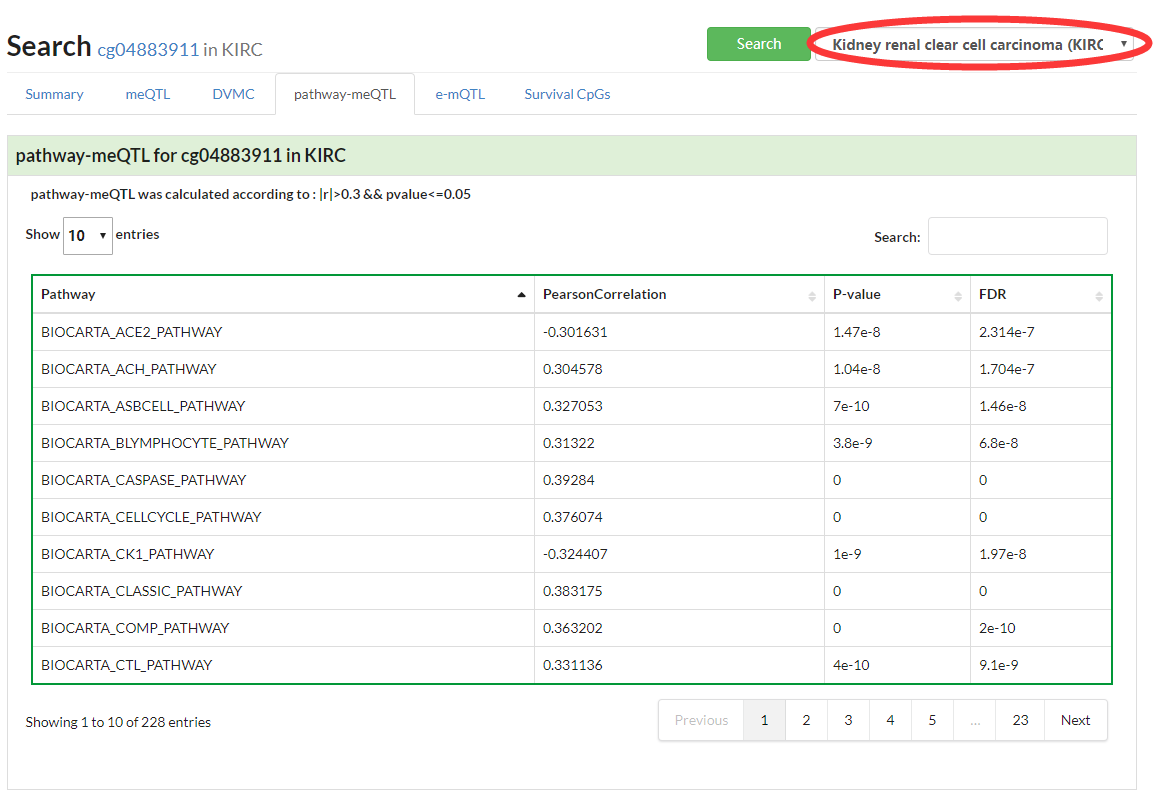
3.4 pathway-meQTL
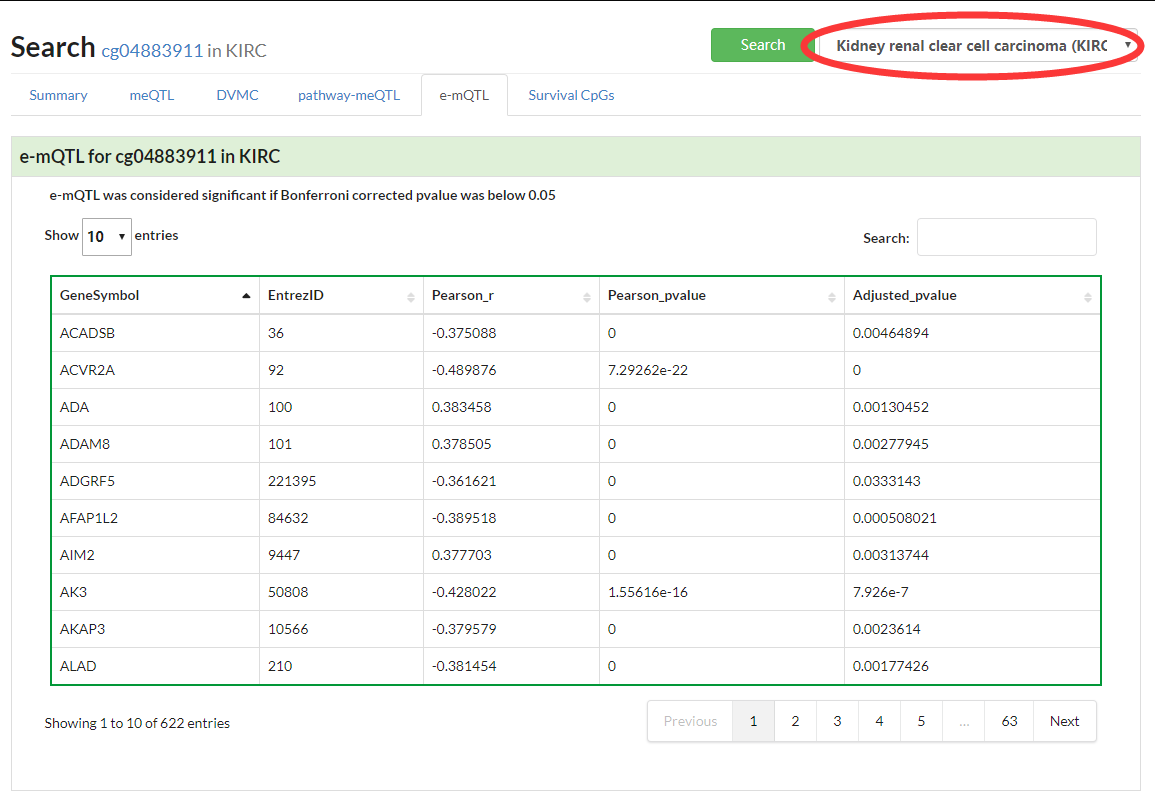
3.5 e-mQTL
3.6 Survival (Kaplan-Meier curve)
4. Information for genes
4.1 Summary
4.2 DMG(Differentially Methylated Genes)
4.3 Methylation-Expression correlation
4.4 Survival (Kaplan-Meier curve)
4.5 Functional Epigenetic Modules (PPI)
4.6 Functional Epigenetic Modules (COME)
5. What is interactive visualization
|
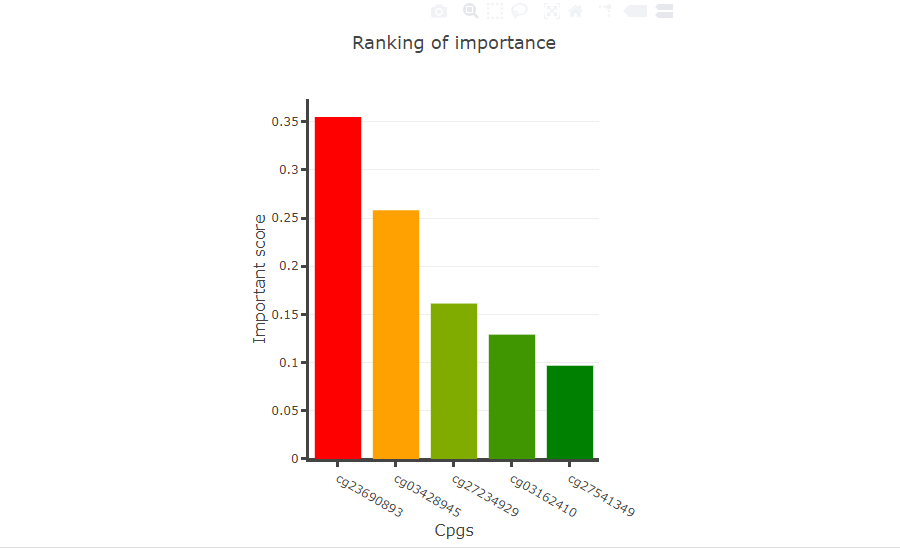
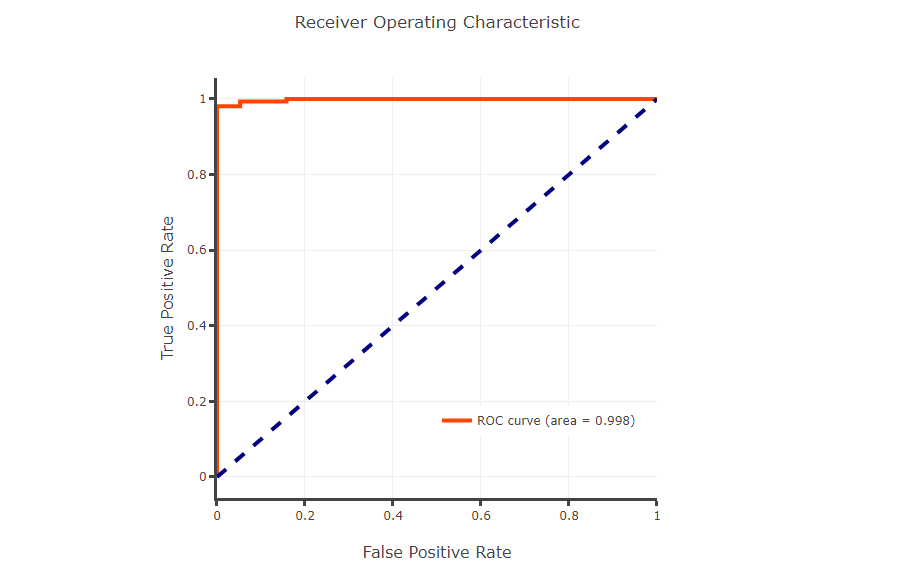
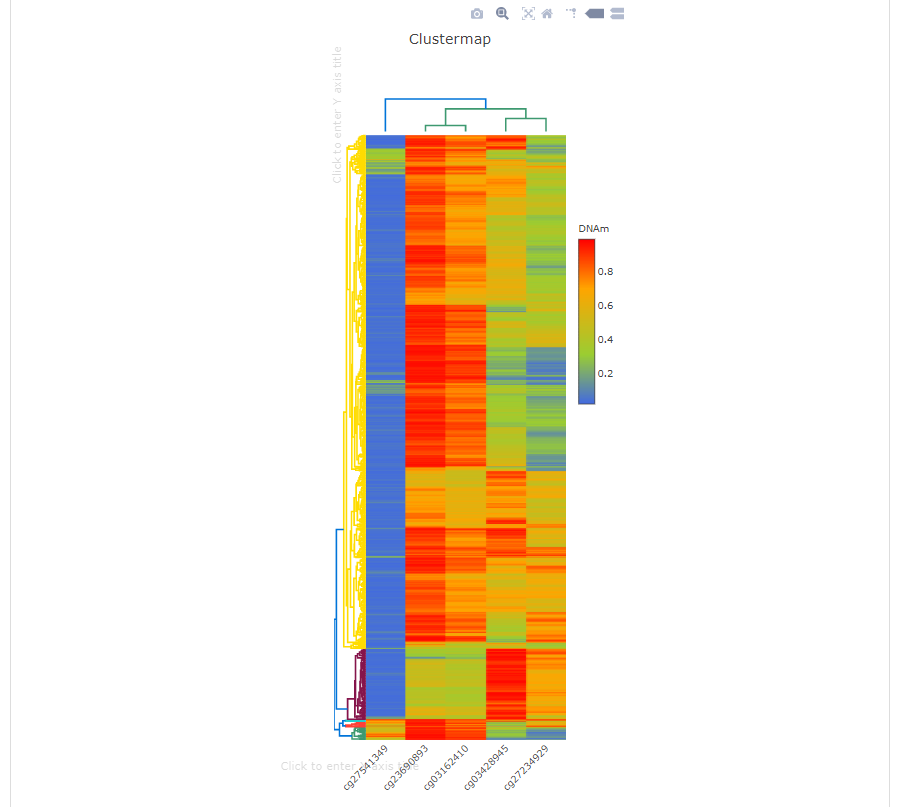
Users upload a list of CpGs or gene symbols, diagnostic model will give a ranking of importance for every CpGs and plot ROC curve and clustering map for distinguishing tumor samples from normal samples.
What's more, users can explore the detail information of interested CpGs or genes, such as DVMC, pathway-meQTl, survival analysis, e-mQTL, meQTL and DMG, Methylation-Expression correlation, survival, Functional Epigenetic Modules.
In the heatmap, the user can click to enter whatever axis title as they want. x, y, z in the tooltip represent CpGs, TCGA samples and DNA methylation level respectively |
|
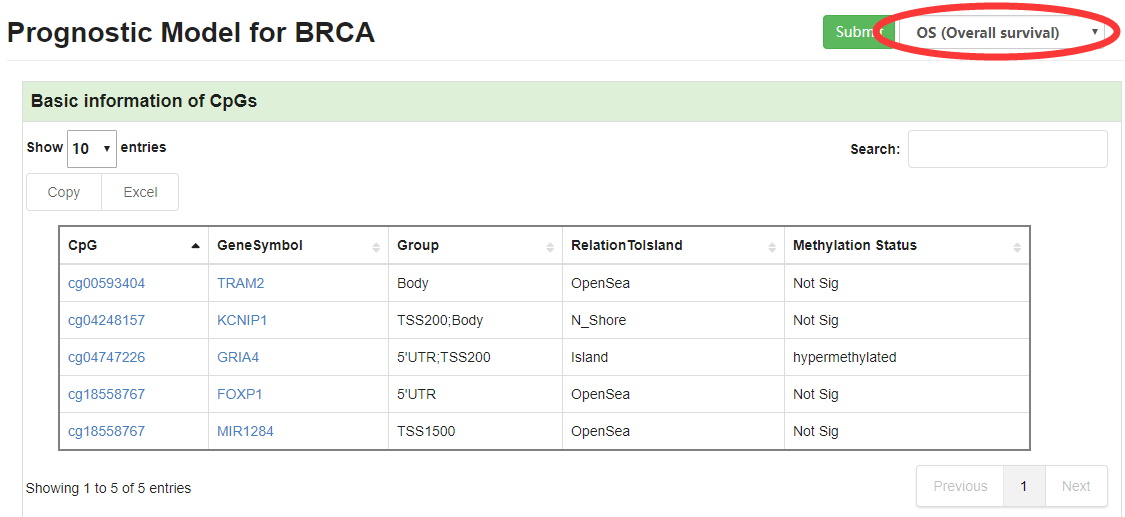
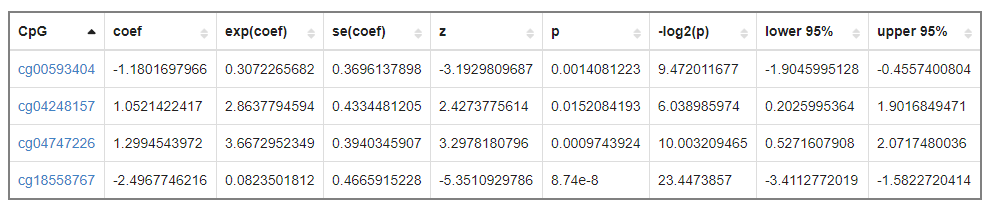
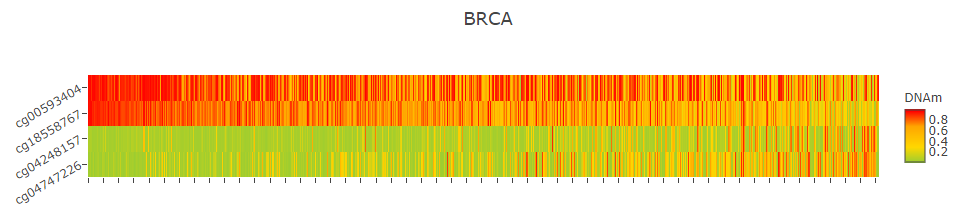
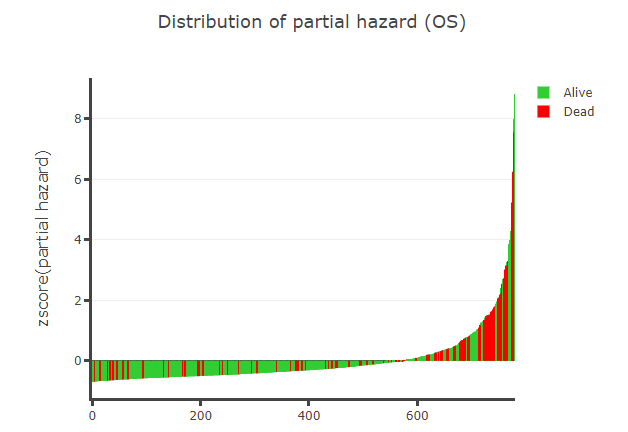
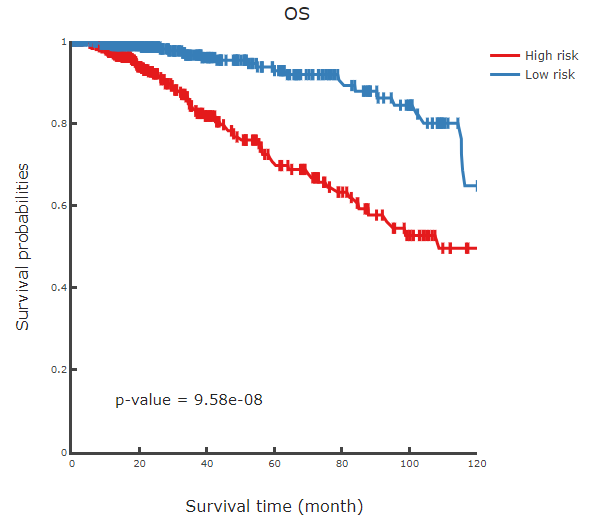
Prognostic model will give prognistic pvalue for every CpGs and display distribution of partial hazard with different endpoint (Overall survival, Disease-Free interval and Progression-Free interval), heatmap and KM curve.
As with diagnostic model, users can explore the detail information of interested CpGs or genes, such as DVMC, pathway-meQTl, survival analysis, e-mQTL, meQTL and DMG, Methylation-Expression correlation, survival, Functional Epigenetic Modules.
In the heatmap, the user can click to enter whatever axis title as they want. x, y, z stand for TCGA samples, CpGs and DNA methylation level respectively.
|
|
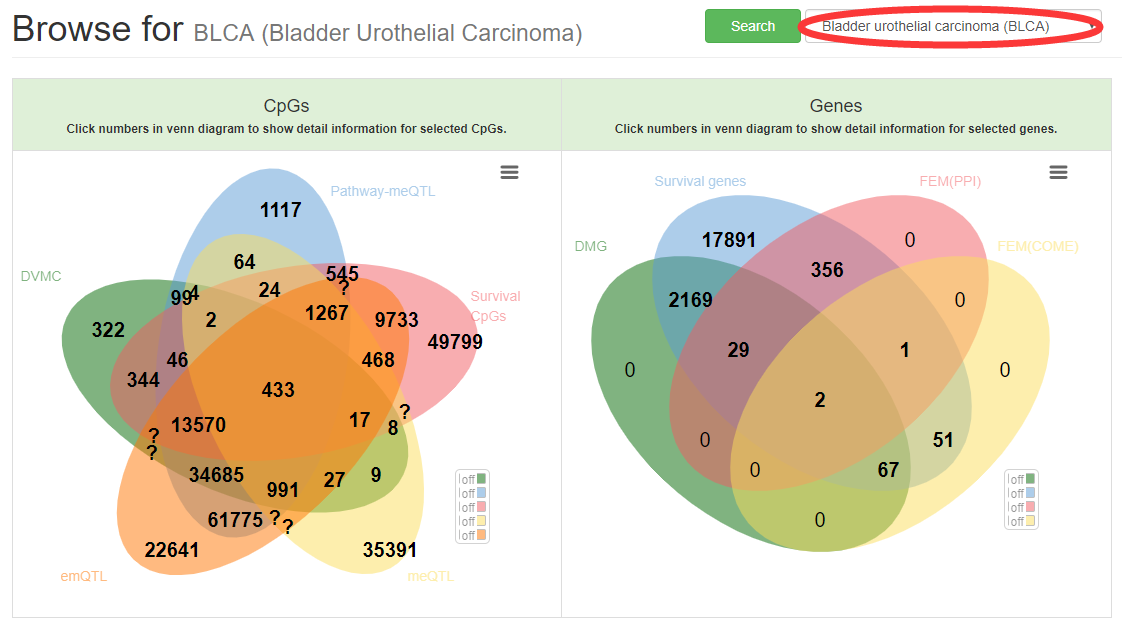
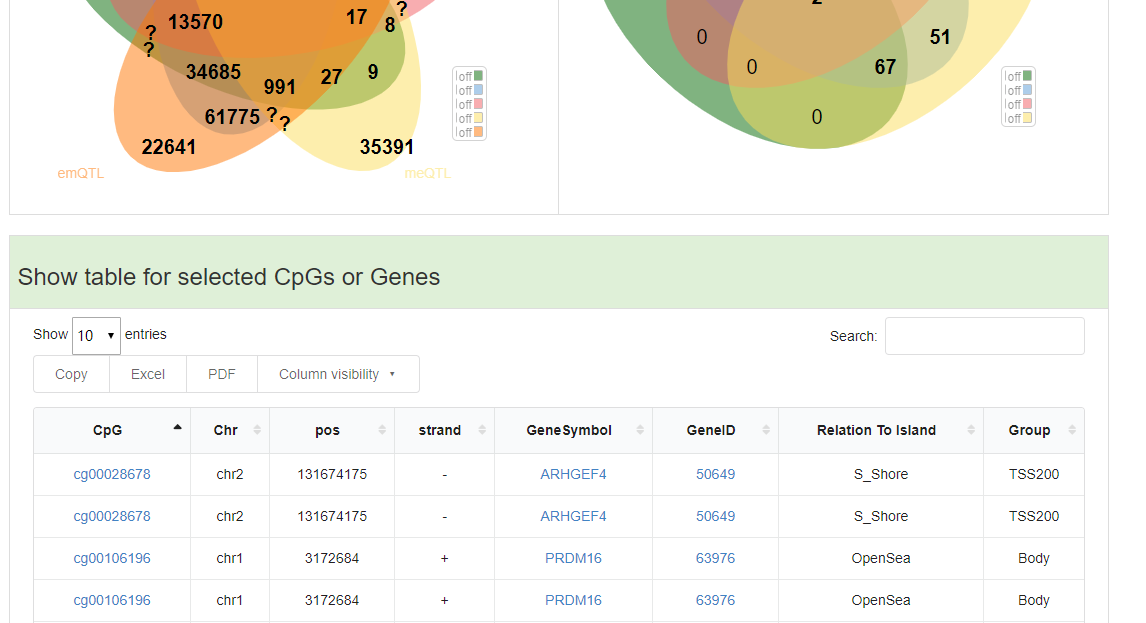
Users can browse CpGs or genes that overlaped between different set for selected cancer type.
The table will display when user click the number within venn diagram.
|
|
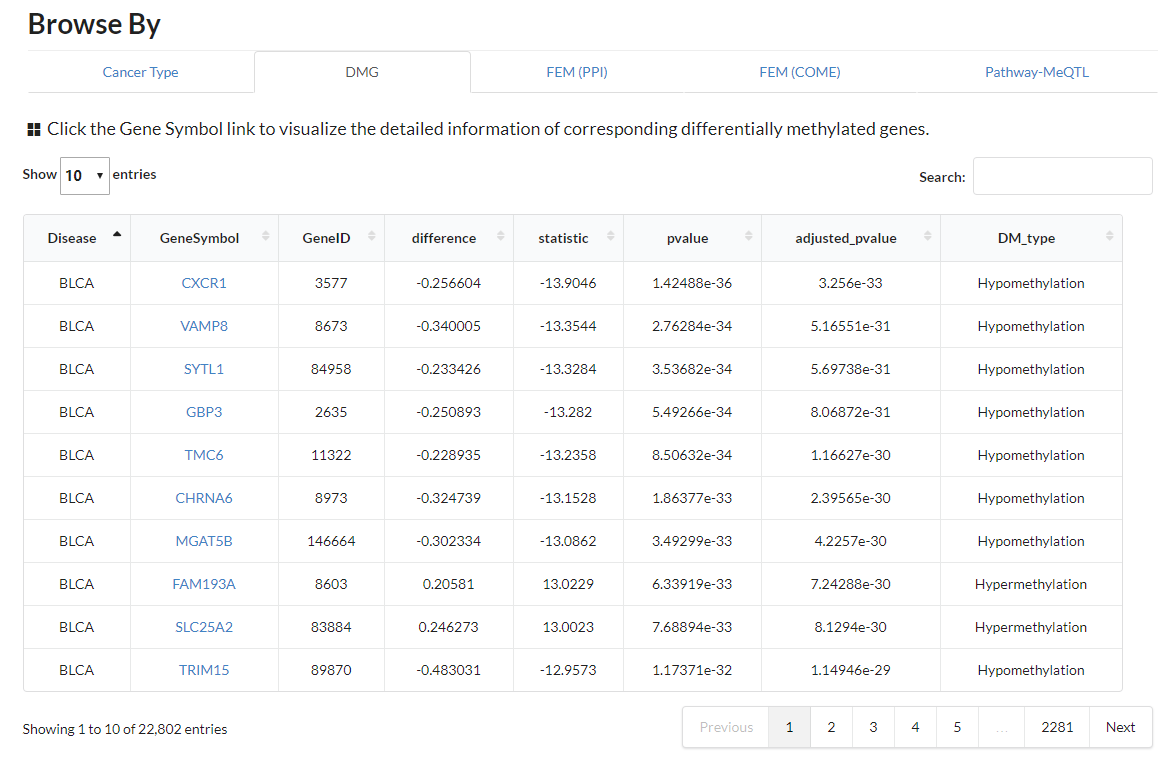
Display all differentially methylated genes in all different cancer types.
|
|
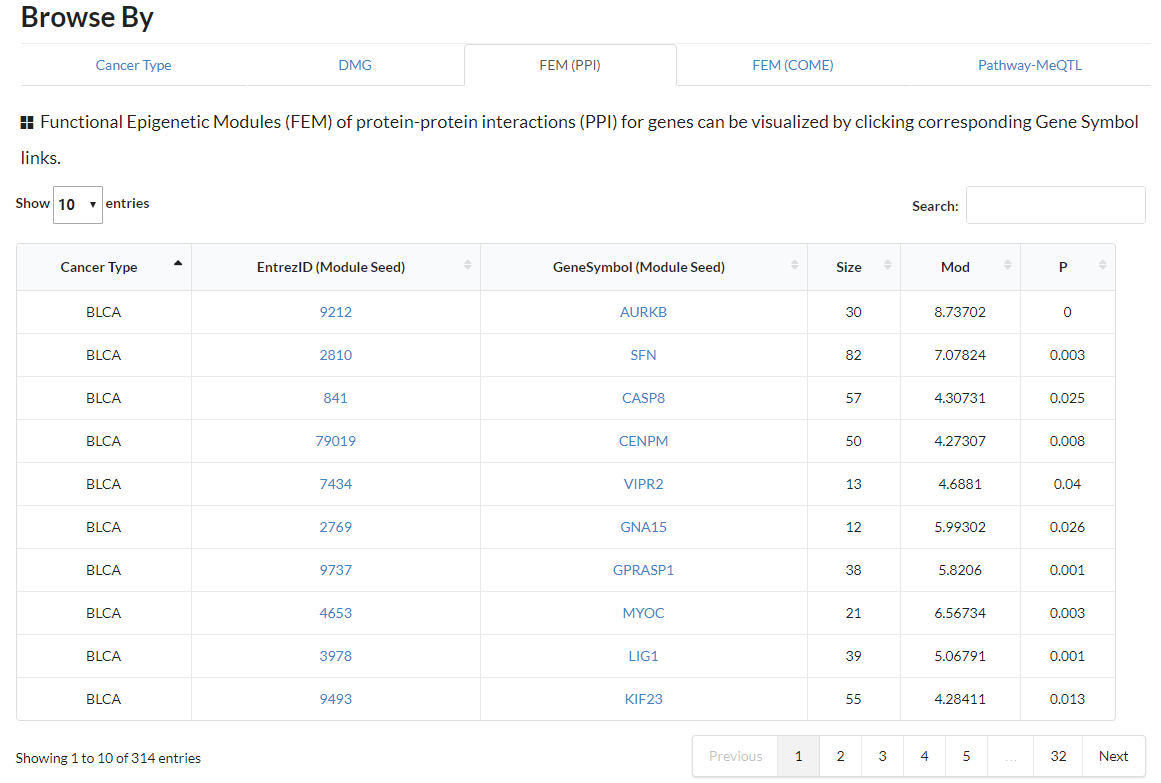
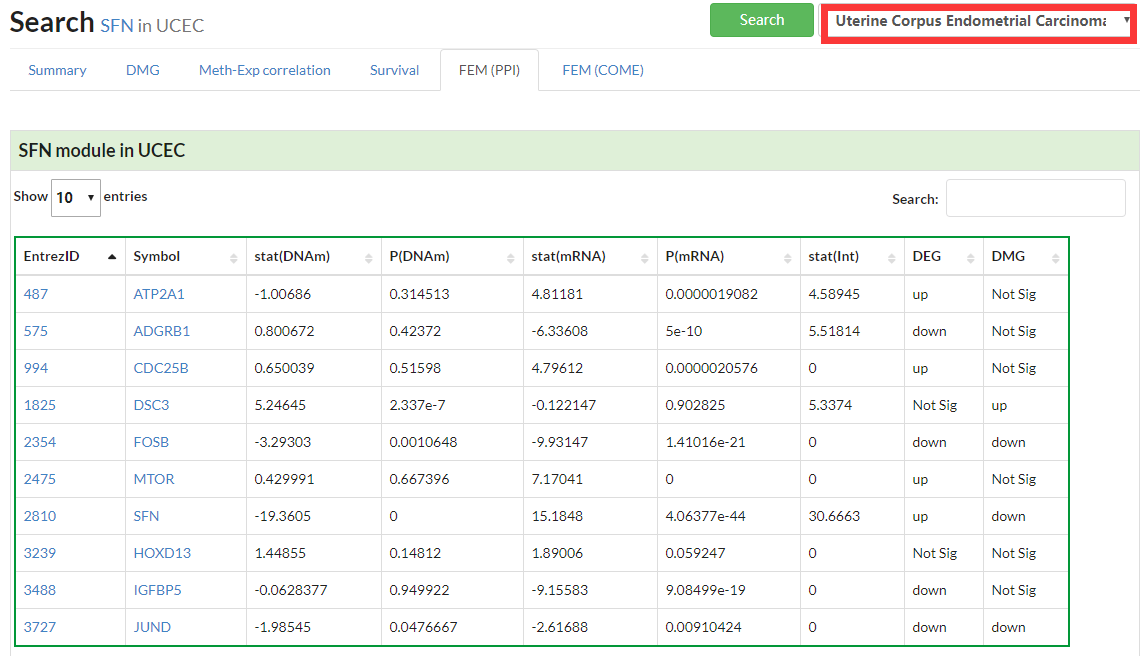
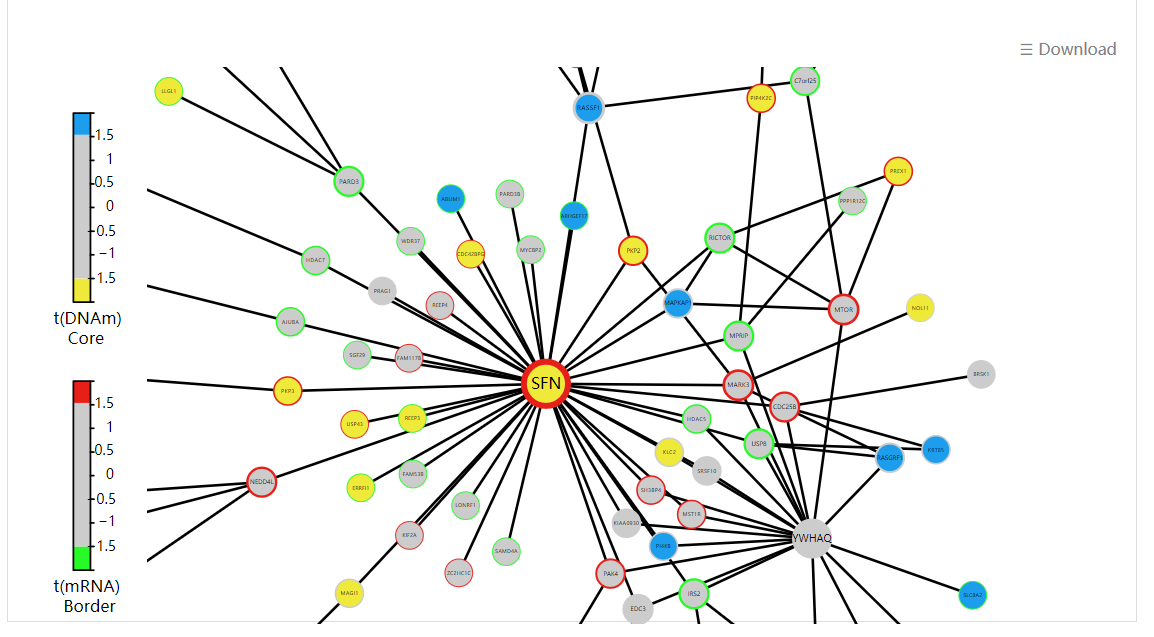
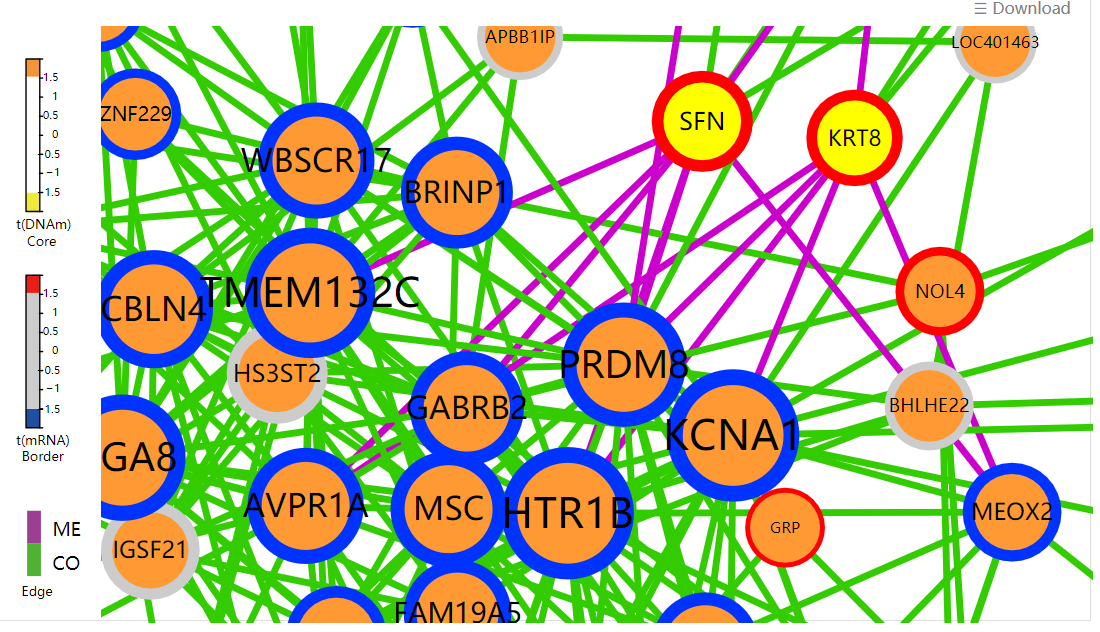
Display all functional epigenetic modules identified by FEM algorithm (Protein Protein Interaction network) in different cancer types.
|
|
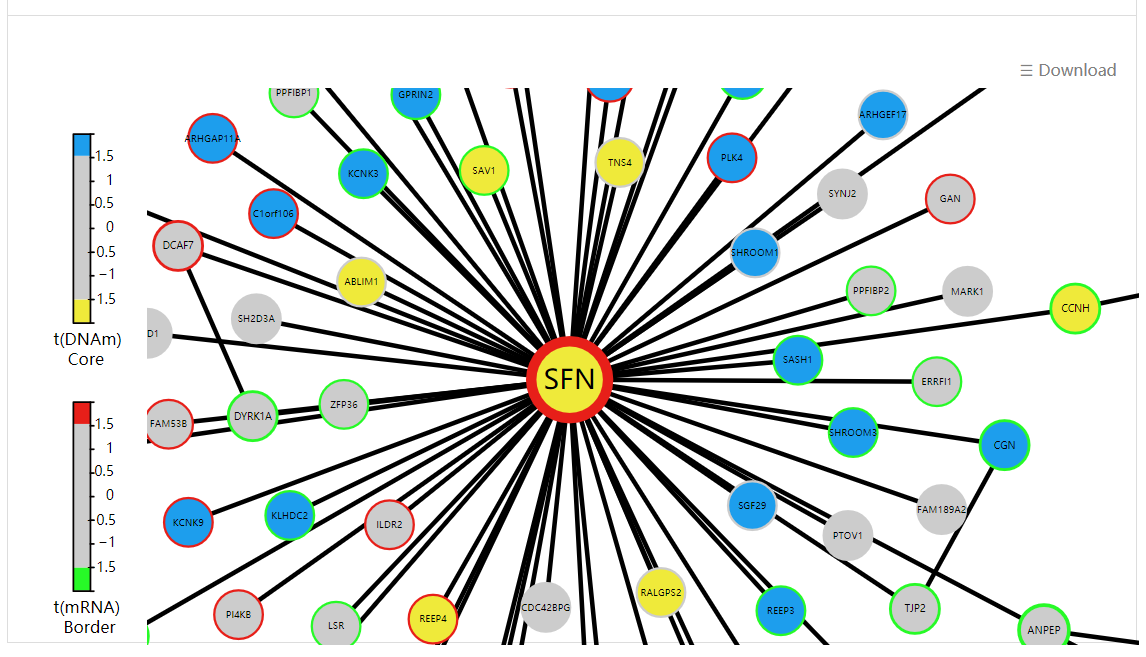
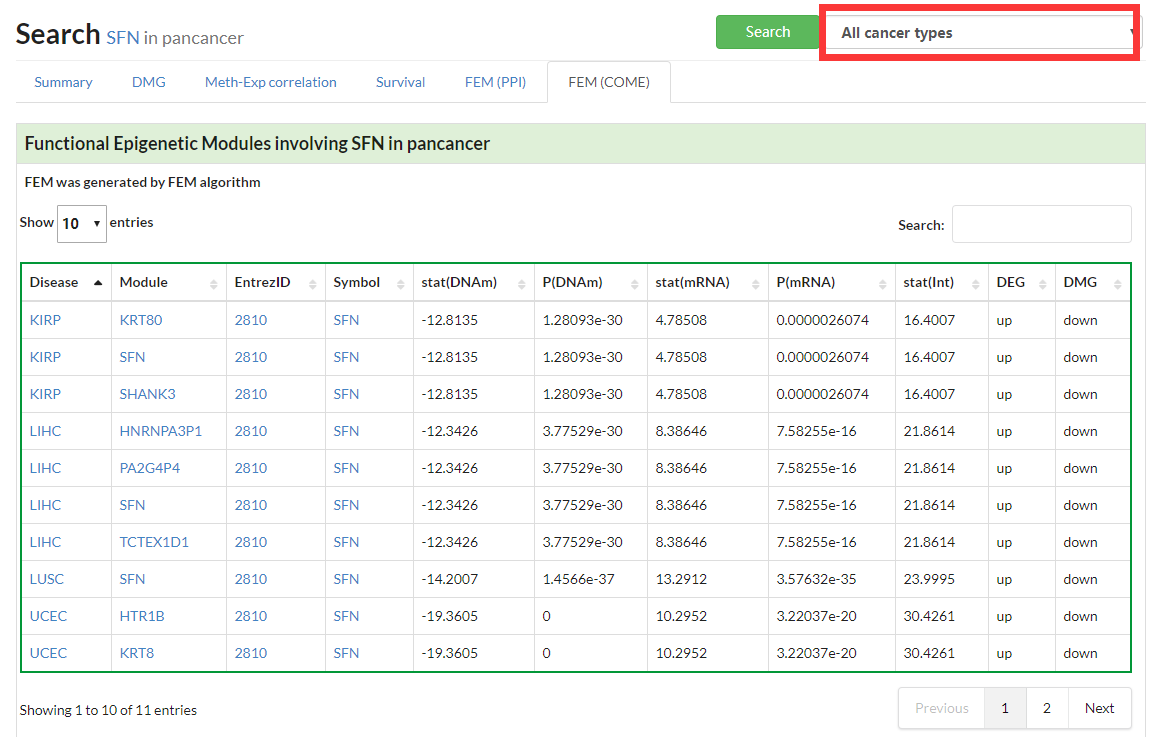
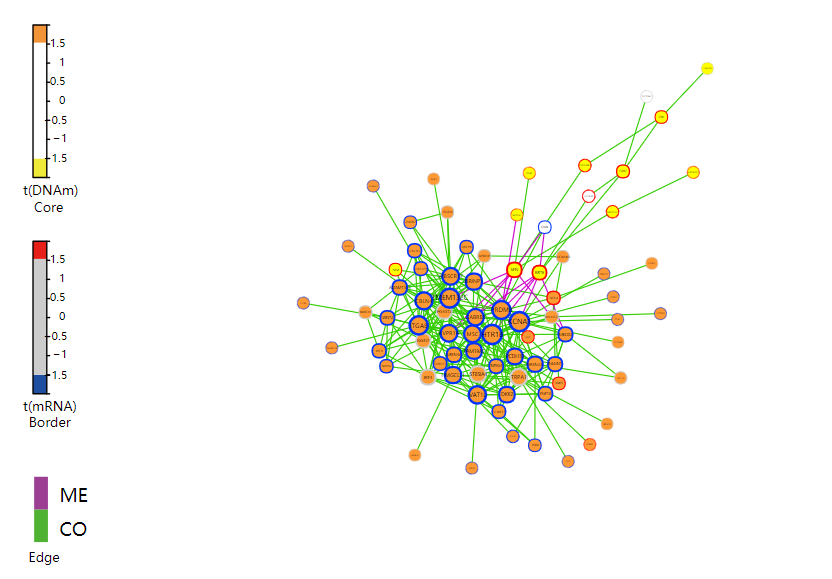
Display all functional epigenetic modules identified by FEM algorithm (Co-Occurrence and Mutual Exclusive network) in different cancer types.
|
|
Display all pathway-meQTL in different cancer types.
|
|
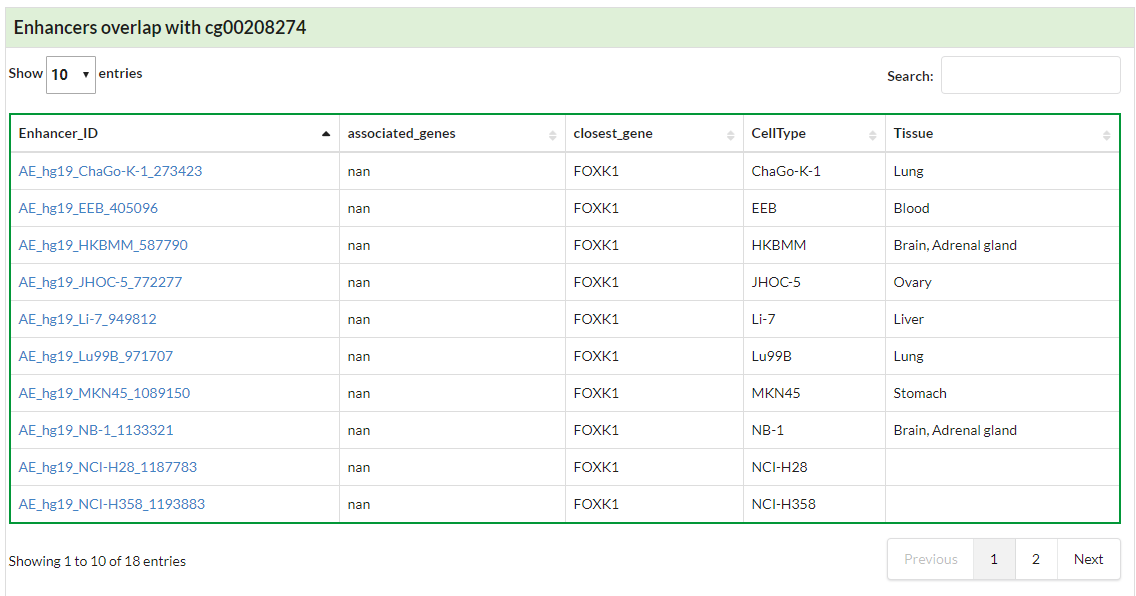
Summary the basic information of searched CpG, including enhancer regions (link to HACER database) overlaped with given CpG.
|
|
Show table for meQTL (link to Pancan-meQTl database).
|
|
Show visualization of Differentially Variable and Differentially Methylated CpGs in given cancer.
If no specific cancer type was selected, a table of DVMCs in pancancer would be displayed.
|
|
Show a heatmap of pathway-meQTL in pancancer or a table in a selected cancer type.
|
|
Show a heatmap of e-mQTL in pancancer or a table in a selected cancer type.
|
|
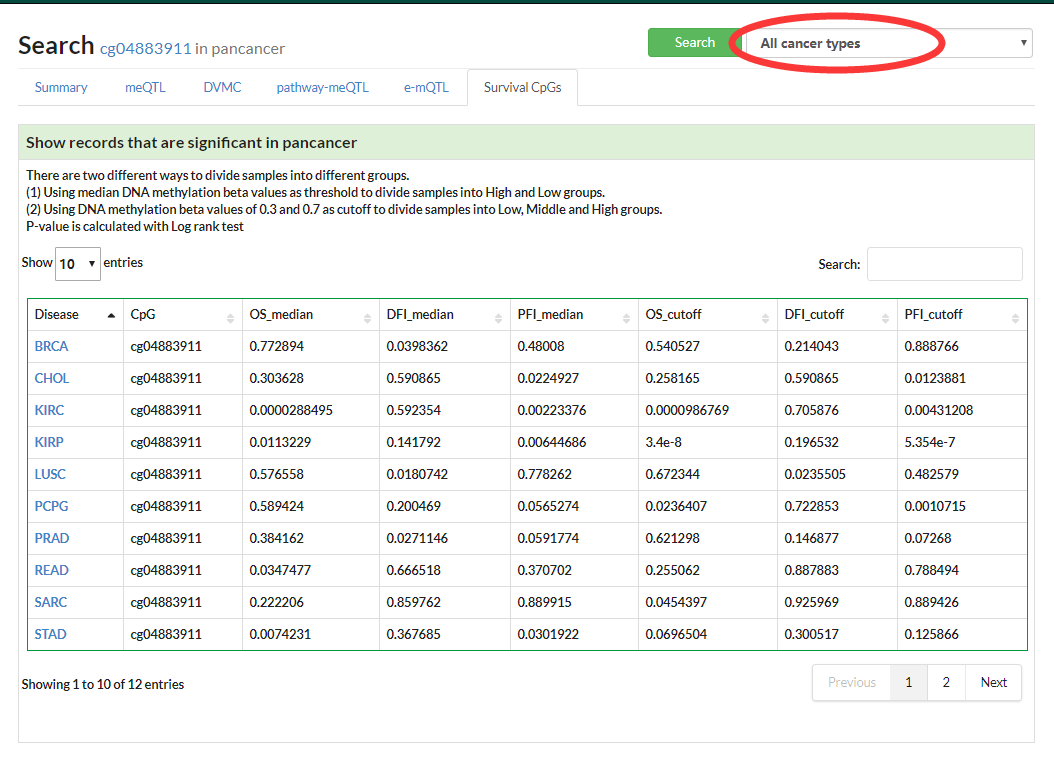
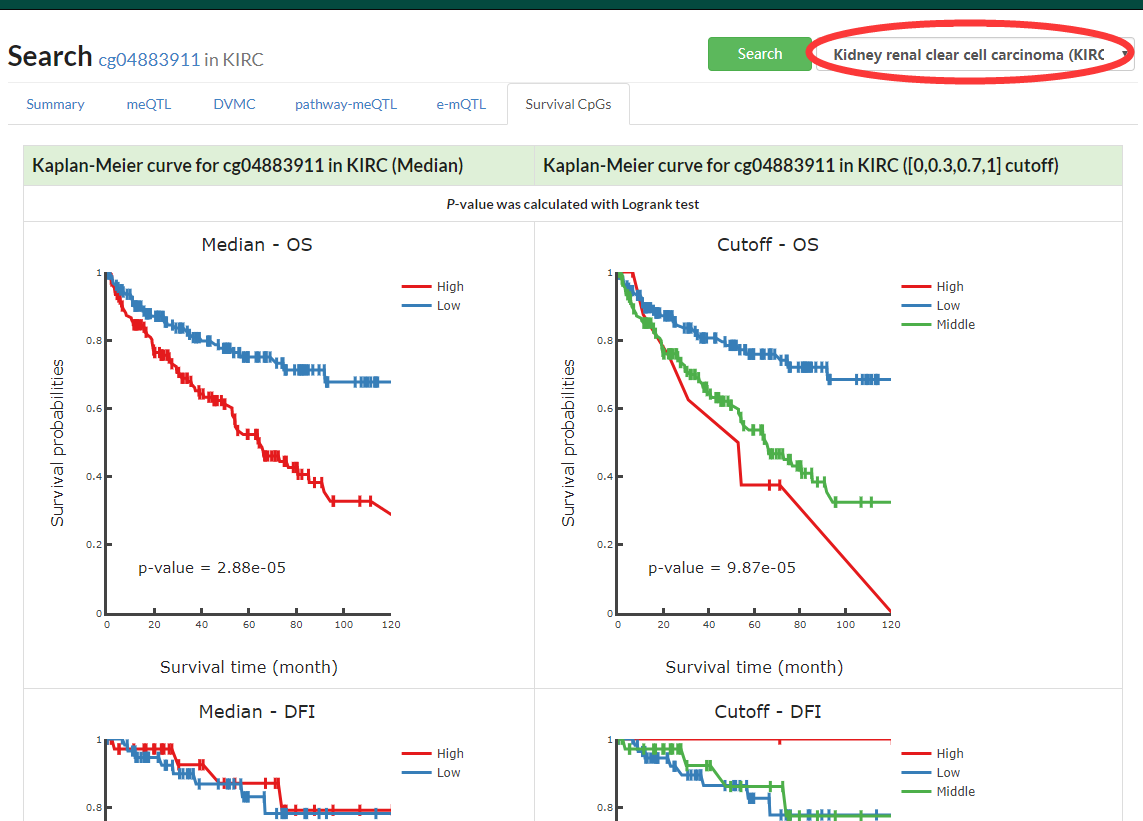
Show interactive KM plot for one specific cancer or a table with Log Rank test p-value for pancancer.
|


|
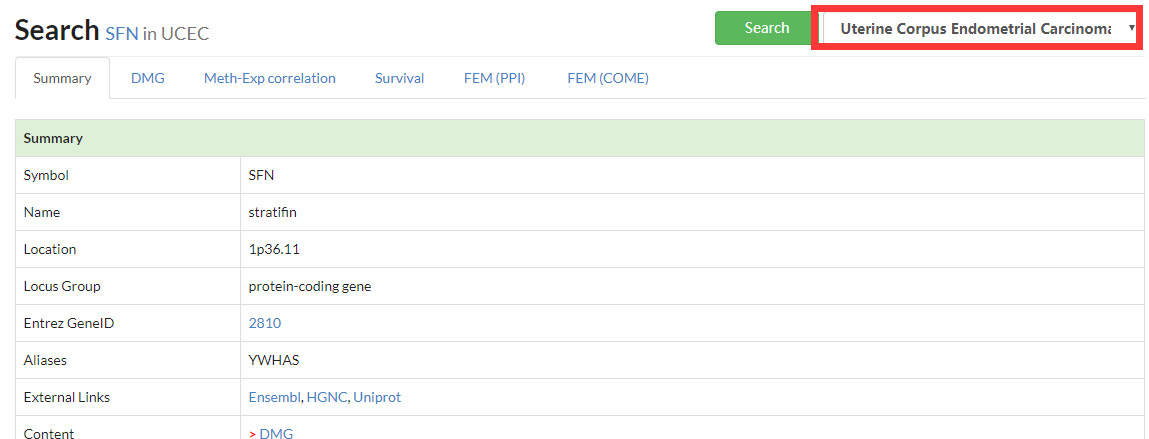
Summary the basic information of searched genes, including CpGs located at given CpG.
|
|
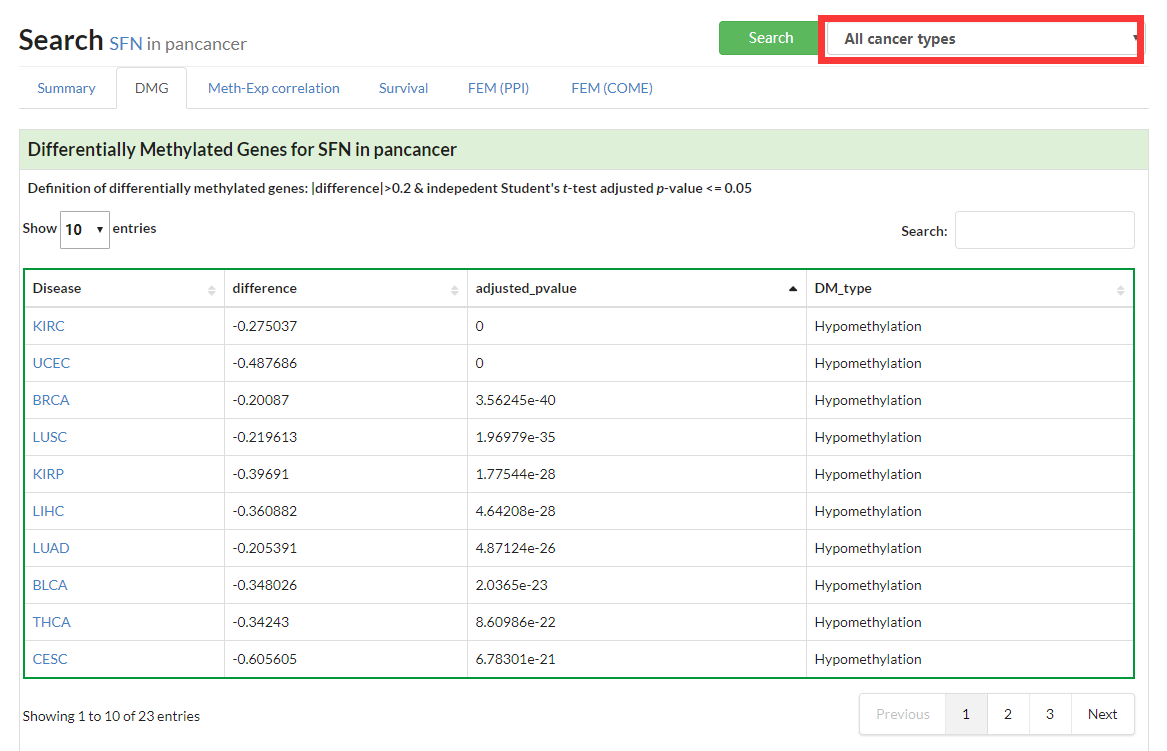
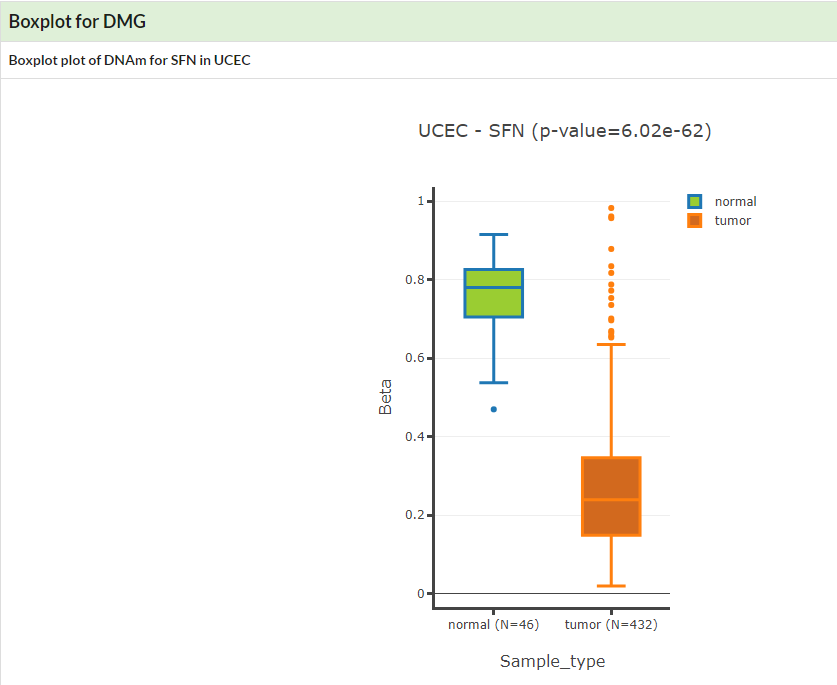
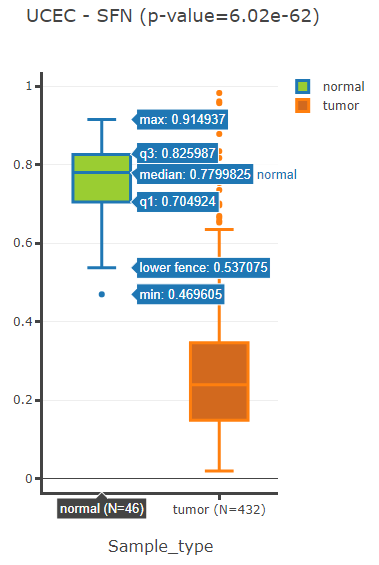
Show boxplot of Differentially Methylated Gene in given cancer.
If no specific cancer type was selected, a table of DMGs in pancancer would be displayed.
|
|
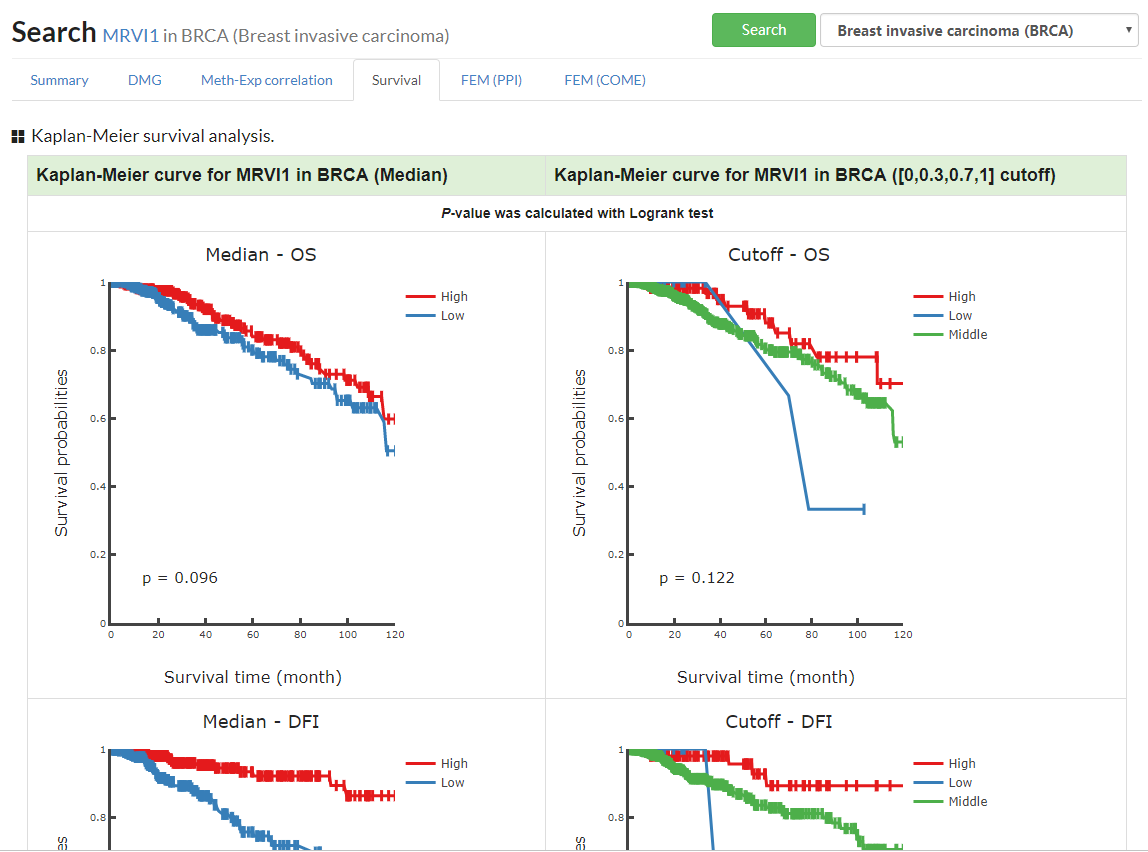
Show interactive KM plot for one specific cancer or a table with Log Rank test p-value for pancancer.
|
|
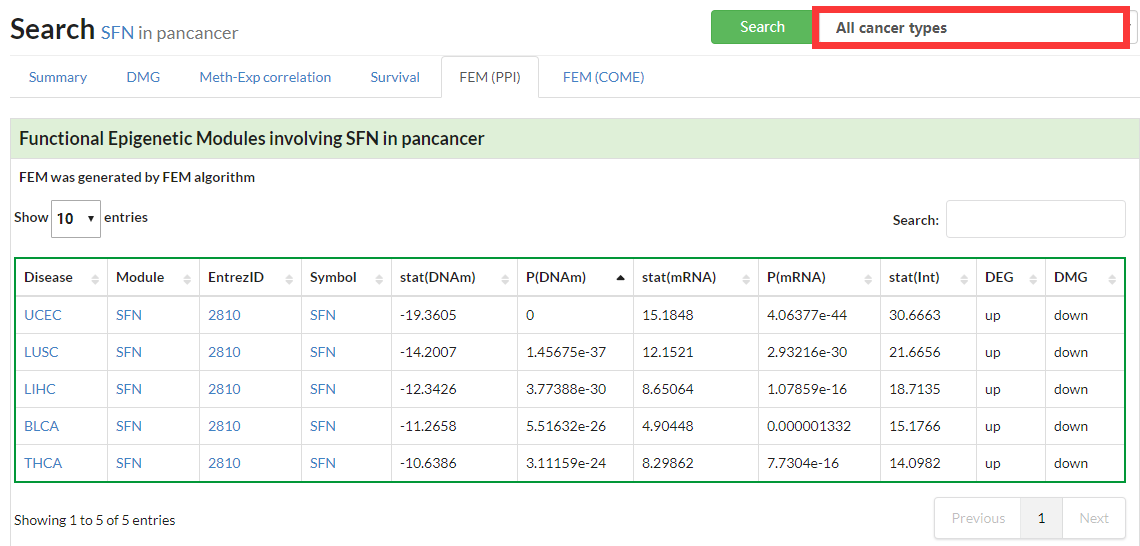
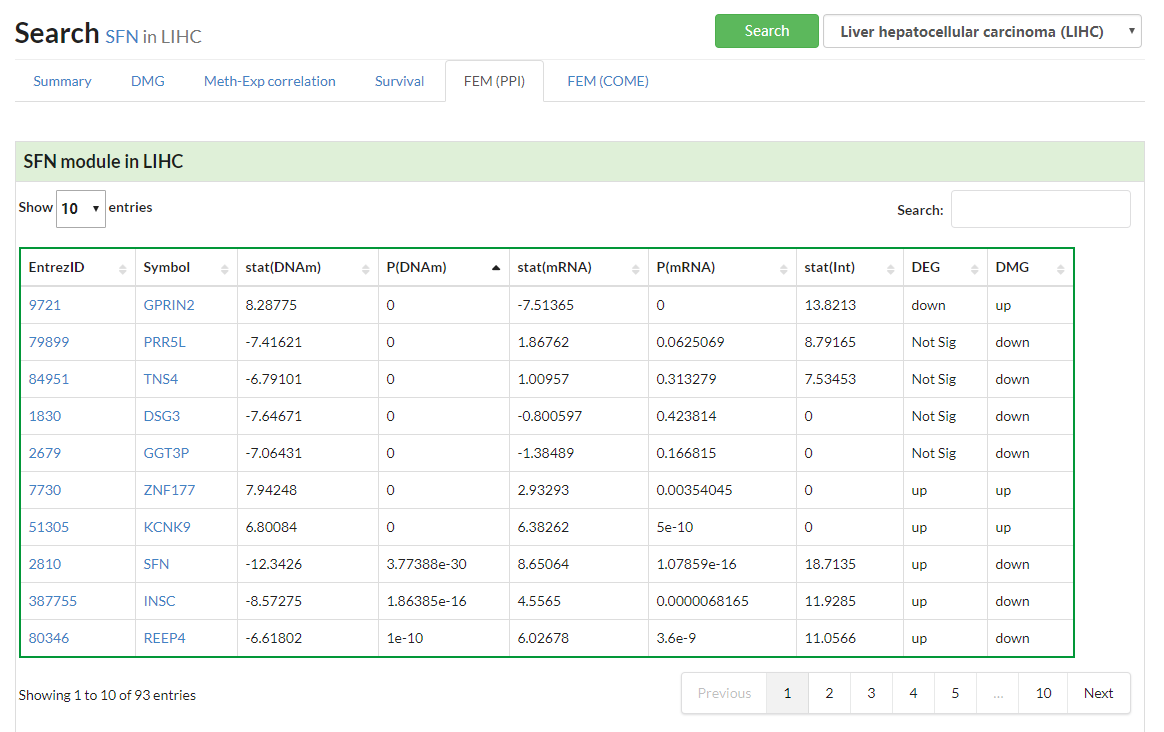
Display all functional epigenetic modules identified by FEM algorithm (Protein Protein Interaction network) in different cancer types.
|
|
Display all functional epigenetic modules identified by FEM algorithm (Co-Occurrence and Mutual Exclusive network) in different cancer types.
|
|
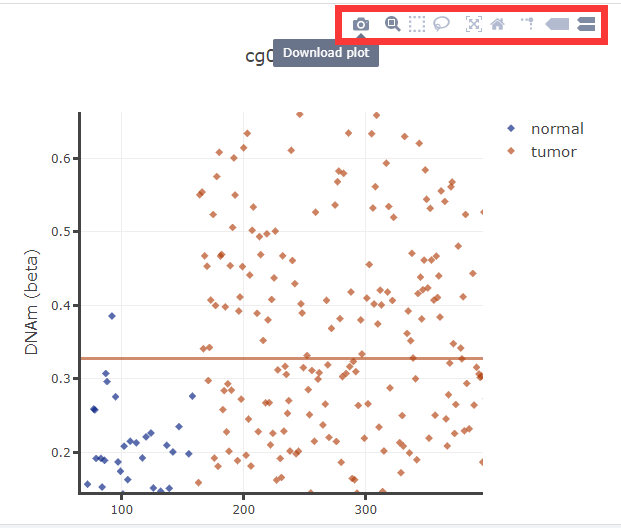
(1) Data will show when mouse move over.
(2) User can zoom out or zoom in by scrolling mouse wheel.
(3) Toolbar will show when mouse move over, and user can download, select, zoom or reset the diagram.
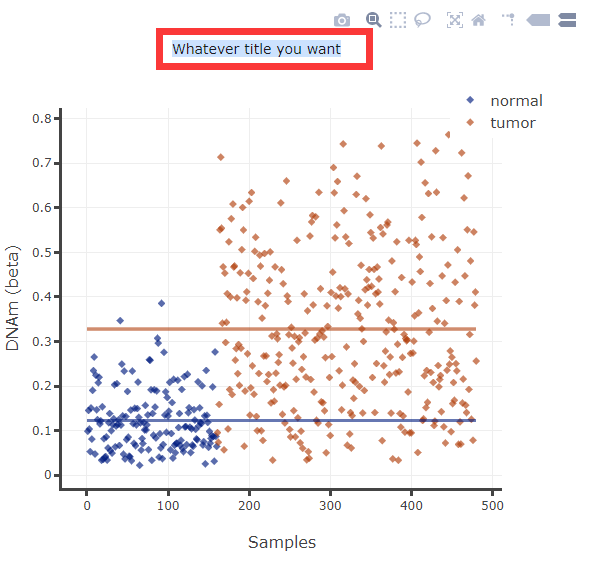
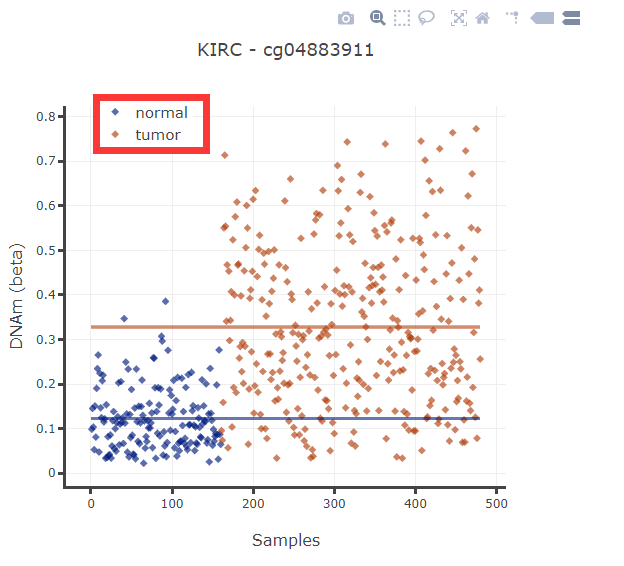
(4) User can change title, xlabel, ylabel and move the legend.
|
|
With simple search, the user only need to input a gene symbol or Entrez gene id. Then the result for the corresponding gene in pan-cancer will be shown.
|
|
In advanced search, the user can select CpG or gene, as well as different cancer types.
|
Scientific ProblemsWe welcome any suggestions regarding how to improve our database, please feel free to contact us with feedback. Tieliu Shi: tlshi@bio.ecnu.edu.cn Technical ProblemsIf you have any questions about the usage of DNMIVD and the interpretation of results, or encounter problems when using DNMIVD, please contact Wubin Ding: ding_wu_bin@163.com |
Website Compatibility: Google Chrome is recommended
Citation: [2] Wubin Ding, Jiwei Chen, Guoshuang Feng, Geng Chen, Jun Wu, Yongli Guo, Xin Ni, Tieliu Shi, DNMIVD: DNA methylation interactive visualization database, Nucleic Acids Research, 48(D1), D856-D862.[ Full Text ]
Citation: [3] Ding, W., Feng, G., Hu, Y., Chen, G., & Shi, T. (2020). Co-occurrence and mutual exclusivity analysis of DNA methylation reveals distinct subtypes in multiple cancers. Frontiers in cell and developmental biology, 8, 20.[ Full Text ]